
As a performance focused audio ads platform having clear and actionable analytics is a high priority for our users. With our advanced analytics suite Decibel delivers all the insights you need to understand exactly what is happening with your campaigns.
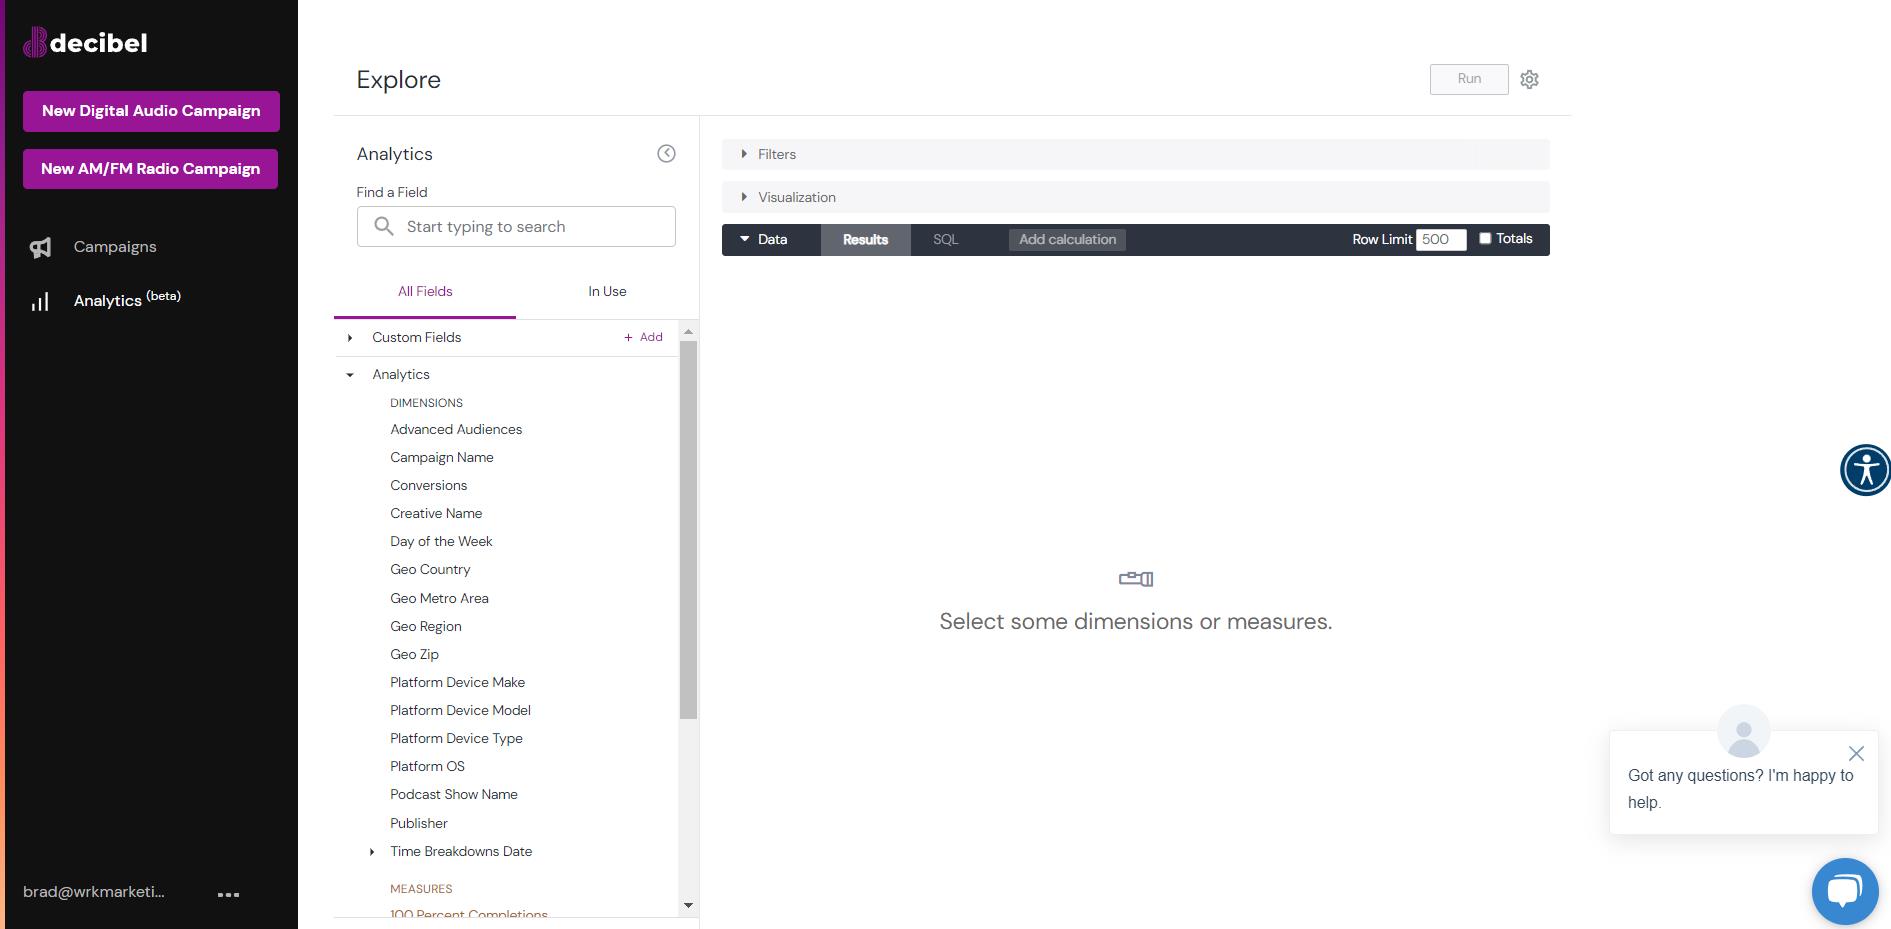
A list and explanation of breakdown fields.
- Advanced Audiences – A breakdown of your selected metrics based on the advanced audiences you targeted in your campaigns.
- Campaign Name – A breakdown of your selected metrics based on your campaign name(s).
- Conversions – A breakdown of your selected metrics based on your conversions.
- Creative Name – A breakdown of your selected metrics based on individual ad performance by name.
- Day of the Week – A breakdown of your selected metrics based on days of the week. Eg. Monday, Tuesday, etc.
- Geo Country – A breakdown of your selected metrics based on which country or countries your ad ran in.
- Geo Metro Areas – A breakdown of your selected metrics based on which DMA (TV Market / Metro Area) your ad(s) ran in.
- Geo Region – A breakdown of your selected metrics based on which State/Province your campaigns ran in.
- Geo Zip – A breakdown of your selected metrics based on zip codes in the United States.
- Platform Device Make – A breakdown of your selected metrics based on the device makes eg Samsung, Apple, etc. that users listened to your ad on.
- Platform Device Model – A breakdown of your selected metrics based on the device model eg Galaxy S20, iPhone 14 Max, etc. that users listened to your ad on.
- Platform Device Type – A breakdown of your selected metrics based on the device type eg Tablet, Laptop, Mobile Phone etc. that users listened to your ad on.
- Platform OS – A breakdown of your selected metrics based on the device operating system eg iOS, Android, etc. that users listened to your ad on.
- Podcast Show Name – A breakdown of your selected metrics based on podcast show names that your ad ran on. Note that not all podcast networks are transparent with individual show names. If they are though we show them.
- Publisher – A breakdown of your selected metrics based on which publishers your ads ran on. Eg Spotify, iHeart Radio, etc.
- Time Breakdown Dates – This has the following sub-categories of Date (eg 2/10/23), Month (eg February), Quarter (eg Q1), Time (eg 11am), Week (eg the week of 2/13/23), and Year (eg 2023).
A list and explanation of metrics fields.
- 100 percent completions – The number of your ads that played entirely.
- 75 percent completions – The number of your ads that reached at least 75% play time. Eg 45 seconds in a 60 second ad.
- 50 percent completions – The number of your ads that reached at least 50% play time. Eg. 30 seconds in a 60 second ad.
- 25 percent completions – The number of your ads that reached at least 25% play time. Eg. 15 seconds in a 60 second ad.
- Clicks – The number of clicks your ad received.
- CPC – Cost per click.
- CPM – Cost per 1000 impressions.
- CTR – Click through rate. Eg if you ad got 10 clicks for 100 impressions you would have a 10% CTR.
- Impressions – The number of impressions your ad received. This means your ad was listened to for at least 3 seconds or a user saw a conversion banner ad.
- Spend – The amount you spent on your ads.
- Conversions – The number of conversions your ad received.
Below find an example of what a report would look like broken down by date, publisher, conversions, and geo metro areas. In addition we’ll include the metrics impressions, clicks, and spend.
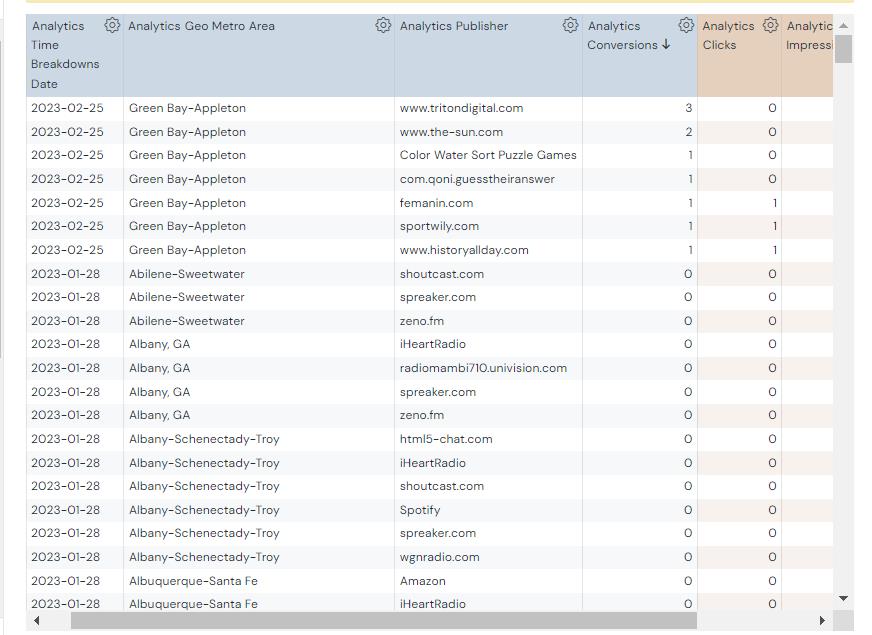
Some notes:
You can export any of these analytics to CSV, can email them on a periodic schedule, and we also have webhooks available that you can use to send them to most 3rd party tools. Eg. Google Data Studio etc.